



YouTube enters the year as one of the world’s largest video, entertainment, search and creator platforms, serving audiences across more than 100 countries and dozens of languages. Its influence now extends well beyond traditional online video, with growing roles in connected-TV viewing, short-form content, music, podcasts, advertising, shopping, education and creator-led businesses. The platform reaches billions of users globally while also supporting a large commercial ecosystem built around advertising, subscriptions and creator monetization.
The statistics in this article examine YouTube’s scale from several angles, including audience growth, demographics, geographic reach, watch time, device usage, Shorts adoption, creator activity, subscriber milestones, advertising revenue, CPM and RPM benchmarks, engagement, discovery, business use and paid subscriptions. Together, these figures provide a detailed view of how YouTube is being used, monetized and expanded.
Editor’s Choice
- 200 billion+ daily Shorts views: YouTube reported that Shorts was averaging more than 200 billion views per day by 2025, and the figure remained a headline platform metric in 2026.
- $60 billion+ in annual revenue: YouTube’s combined advertising and subscription revenue surpassed $60 billion for full-year 2025, according to financial results released in early 2026.
- 84% of U.S. adults: More than eight in 10 American adults reported using YouTube in the 2025 national survey.
- 95% of U.S. adults ages 18-29: YouTube reached nearly all adults in the youngest adult age group measured in the 2025 U.S. survey.
- 518 million potential viewers in India: As of April 2026, India represented YouTube’s largest national advertising audience, ahead of every other measured country.
- 259 million potential viewers in the U.S.: The U.S. ranked second globally by YouTube advertising audience in April 2026.
- 20 billion+ uploaded videos: By YouTube’s 20th anniversary in April 2025, users had collectively uploaded more than 20 billion videos across long-form content, Shorts, music, podcasts and other formats.
- 20 million+ daily uploads: New uploads exceeded 20 million videos on an average day in 2025, equal to hundreds of new uploads every second across the platform.
Recent Developments
- In January 2026, YouTube had ranked No. 1 in U.S. streaming watch time for nearly three years, based on the platform’s latest reported television measurement.
- YouTube’s 2026 strategy continues to center on television: viewers globally already consume more than 1 billion hours on TV screens per day.
- YouTube Shorts entered 2026 averaging more than 200 billion daily views, compared with the milestone first announced in June 2025.
- Full-year 2025 YouTube revenue exceeded $60 billion across advertising and subscriptions, a milestone disclosed with 2025 financial results in February 2026.
- Fourth-quarter 2025 YouTube advertising revenue reached $11.4 billion, up 9% year over year despite comparison with heavy U.S. election advertising in late 2024.
- In September 2025, YouTube said it had paid more than $100 billion to creators, artists and media companies during the preceding four years, highlighting the commercial scale of its creator economy.
- YouTube began integrating AI video creation technology into Shorts in 2025, including tools that can generate video backgrounds or clips with sound and assist with editing.
- By its 20th anniversary in April 2025, the platform had accumulated more than 20 billion uploaded videos, while creators were adding over 20 million more on an average day.
- Television overtook mobile as the primary YouTube viewing device by watch time in the U.S. by early 2025, marking a notable shift from YouTube’s earlier mobile-first consumption pattern.
YouTube Daily Engagement Statistics 2026
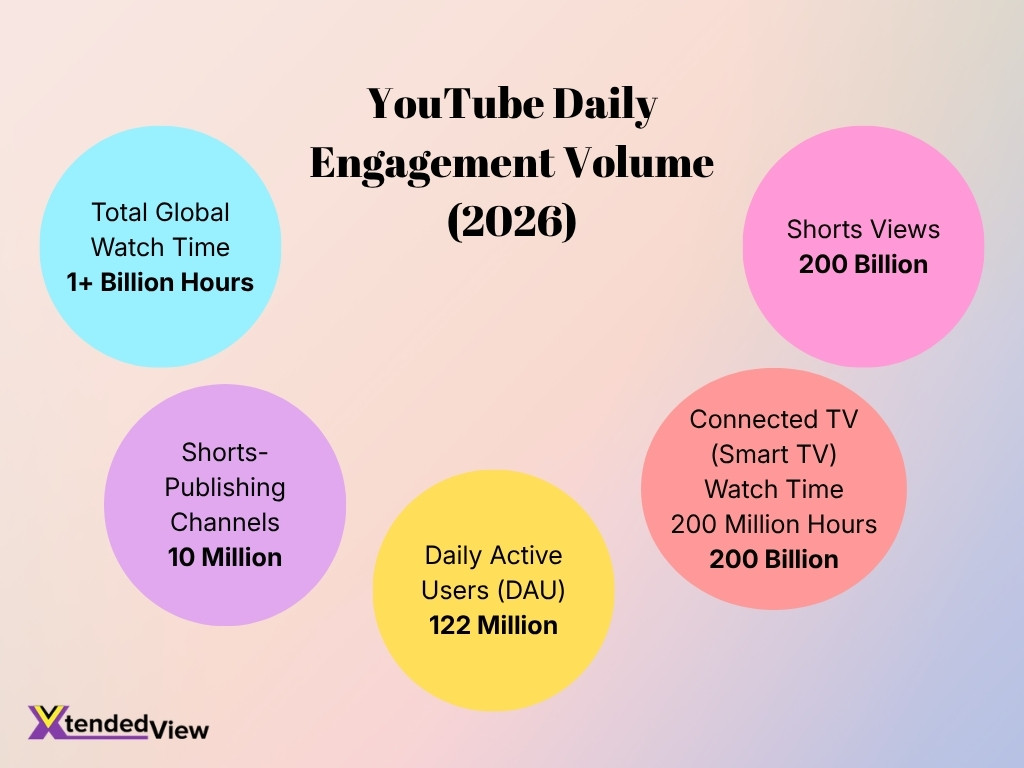
- YouTube records approximately 122 million daily active users (DAUs), highlighting the platform’s massive everyday audience reach.
- YouTube Shorts generates around 200 billion daily views, demonstrating the enormous scale of short-form video consumption.
- Viewers spend about 200 million hours per day watching YouTube on connected TVs and smart TVs, showing its growing presence on larger screens.
- YouTube generates more than 1 billion hours of total global watch time every day, reflecting exceptionally high overall engagement.
- Around 10 million channels publish YouTube Shorts, illustrating the widespread adoption of short-form content among creators.
- With 200 billion Shorts views generated by roughly 10 million Shorts-publishing channels, short-form video remains a major driver of YouTube’s daily content ecosystem.
Global User Base and Reach
- YouTube currently reports billions of monthly logged-in users worldwide rather than publishing a precise global monthly active user count.
- In January 2025, YouTube advertising tools reported a potential audience of 2.53 billion users worldwide.
- That 2.53 billion advertising audience represented approximately 30.9% of the world’s total population at the beginning of 2025.
- YouTube’s January 2025 advertising audience equaled roughly 45.5% of global internet users, demonstrating how broadly the service reaches connected consumers.
- Potential advertising reach increased by 39.7 million users, or 1.6%, between January 2024 and January 2025.
- YouTube provides localized services in 100+ countries and approximately 80 languages, helping the platform serve audiences beyond English-speaking markets.
- India alone had a potential YouTube advertising audience of 500 million in late 2025, equivalent to 34.1% of the country’s total population.
- In the U.S., YouTube’s potential advertising audience stood at 254 million in late 2025, equivalent to 73% of the country’s population and 78.4% of its internet population.
- By April 2026, India’s estimated advertising audience had risen to 518 million, while the U.S. reached 259 million, showing that YouTube’s largest markets continued to expand into 2026.
Monthly and Daily Active Users
- YouTube’s official 2026 materials describe the service as attracting billions of monthly logged-in users, confirming a multibillion-user monthly footprint without providing a more precise MAU figure.
- Advertising tools measured 2.53 billion potentially reachable YouTube users worldwide in January 2025. This provides a useful scale indicator but should not be labeled as MAU.
- Approximately 84% of U.S. adults reported using YouTube in a survey conducted from February through June 2025.
- About half of U.S. adults said they visited YouTube at least once a day in a separate February-March 2025 frequency survey.
- 33% of U.S. adults said they used YouTube several times a day in that 2025 survey, indicating that much of YouTube’s American audience engages repeatedly rather than occasionally.
- Roughly three-quarters of U.S. teens reported visiting YouTube daily in a survey conducted in September and October 2025.
- About one in five U.S. teens described their YouTube use as “almost constant” in 2025, placing the platform among the most frequently accessed digital services for teenagers.
- Daily intensity differs by gender among teens: 20% of boys versus 13% of girls said they used YouTube almost constantly in the 2025 teen survey.
- Among Black U.S. teens, 35% said they used YouTube almost constantly, compared with 23% of Hispanic teens and 8% of White teens in the same survey.
YouTube User Distribution by Age and Gender
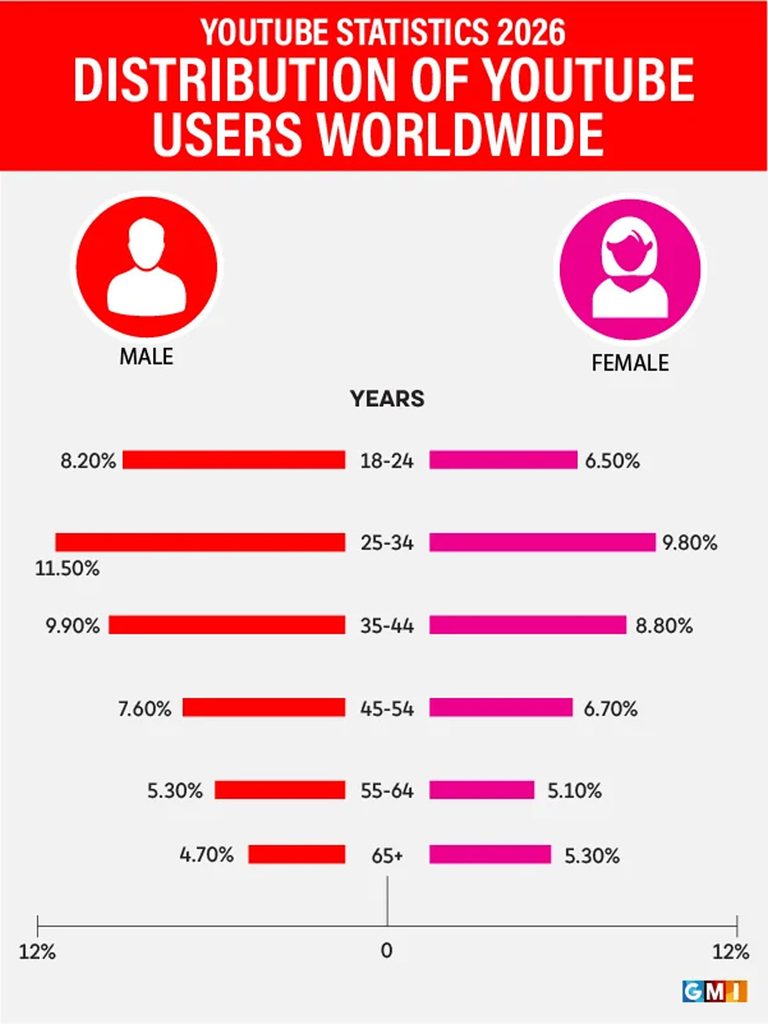
- Ages 25–34 represent the largest YouTube audience segment, accounting for 11.5% of male users and 9.8% of female users.
- Among 35–44-year-olds, male users account for 9.9%, compared with 8.8% for female users.
- The 18–24 age group represents 8.2% of male users and 6.5% of female users, showing a 1.7 percentage-point gender gap.
- Users aged 45–54 account for 7.6% of males and 6.7% of females in the worldwide YouTube audience.
- The gender distribution becomes nearly equal among 55–64-year-olds, with 5.3% male and 5.1% female users.
- The 65+ segment is the only age group shown where women have a larger share, at 5.3% female versus 4.7% male.
- Overall, male users have a higher share across five of the six age groups, while female users lead only in the 65+ category.
Time Spent and Watch Time on YouTube
- Viewers worldwide watch more than 1 billion hours of YouTube on television screens every day, making TV one of the platform’s core consumption surfaces in 2026.
- YouTube accounted for a record 13.8% of total U.S. television watch time in May 2026, its highest measured share at that point.
- Streaming as a whole reached 48.6% of U.S. TV viewing in May 2026, giving YouTube room to compete for viewing time once dominated by broadcast and cable.
- In July 2025, YouTube captured 13.4% of U.S. television watch time, up substantially from the platform’s share a year earlier.
- YouTube represented 12.5% of U.S. TV viewing in May 2025, when streaming surpassed broadcast and cable combined for the first time.
- In April 2025, the platform reached 12.4% of U.S. TV watch time, compared with 9.6% in April 2024, a gain of 2.8 percentage points in one year.
- YouTube’s TV share stood at 11.1% in December 2024, after television viewing of the service increased 7% from November.
- The typical YouTube Android app session lasted 14 minutes and 29 seconds globally in August 2025, the longest average session among the leading social apps measured.
- A typical YouTube Android user opened the app 5.9 times per day in August 2025. Combined with long sessions, that pattern points to repeated, high-duration viewing throughout the day.
- In the U.S., monthly active mobile users spent an average of 11 hours and 32 minutes per month in the YouTube app in August 2025, leading the social apps measured for monthly engagement.
Mobile and Desktop Usage on YouTube
- YouTube recorded an estimated 1.21 billion daily active app users in 2026 measurement data, highlighting the scale of its app-based audience.
- Its app posted a 62% daily stickiness rate, meaning daily active users represented a large share of its broader active app audience.
- Between May 2025 and April 2026, youtube.com generated approximately 352.8 billion web visits worldwide, showing that browser-based consumption remains substantial despite the dominance of apps.
- In July 2026, youtube.com remained the No. 2 most-visited website worldwide, with an average visit lasting 19 minutes and 5 seconds.
- Visitors viewed an average of 11.81 pages per web visit in July 2026, while the measured bounce rate was only 23.26%.
- In April 2026, average web visit duration was 18 minutes and 48 seconds, with 11.65 pages viewed per visit.
- Global youtube.com traffic in June 2026 came primarily from mobile devices, confirming that smartphones continue to lead browser traffic as well as app consumption.
- One June 2026 traffic dataset estimated that 68.5% of youtube.com visits came from mobile devices, versus 31.5% from desktop devices.
- However, screen size tells a different story when measured by watch time: television had become the primary YouTube viewing device in the U.S. by watch time by early 2025.
- This shift has continued into 2026, when YouTube remained the largest U.S. television distributor by viewing share and reached 13.8% of TV watch time in May.
Geographic Distribution and Top Countries by Audience
- India ranked as YouTube’s largest advertising market by audience in April 2026, with approximately 518 million potentially reachable users.
- The United States ranked second with approximately 259 million potential advertising viewers in April 2026.
- Indonesia ranked third globally in April 2026, with an advertising audience of roughly 151 million users according to the latest country ranking.
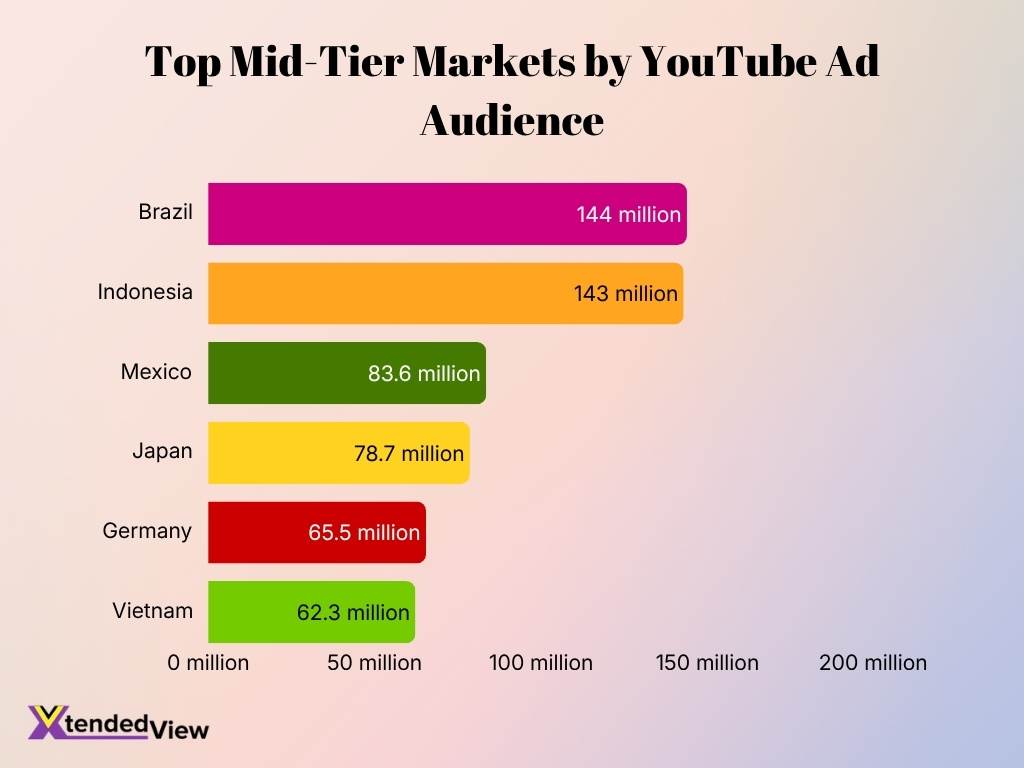
- In January 2025 data, Brazil had roughly 144 million reachable YouTube users, making it one of the platform’s largest national audiences.
- Indonesia’s advertising audience stood at approximately 143 million in the comparable 2025 dataset, placing it close to Brazil at that point.
- Mexico accounted for approximately 83.6 million potentially reachable YouTube users in 2025.
- Japan had an estimated advertising audience of 78.7 million in the 2025 country data, making it one of YouTube’s largest mature Asian markets.
- Germany had approximately 65.5 million reachable YouTube users in the 2025 advertising dataset, while Vietnam had about 62.3 million.
- India also recorded significant year-over-year expansion: its potential YouTube advertising audience increased by 9 million users, or 1.8%, between the end of 2024 and late 2025.
- Geographic reach does not always move with absolute audience size. In late 2025, YouTube ads reached 78.4% of U.S. internet users, compared with 48.7% of India’s internet population, even though India had almost twice as many potentially reachable users in absolute terms.
Shorts Statistics and Growth on YouTube
- YouTube Shorts averages more than 200 billion views every day in 2026.
- The 200 billion daily-view milestone was first announced in June 2025, meaning Shorts entered 2026 operating at roughly 6 trillion views per month if daily activity remained near that level.
- At 200 billion daily views, Shorts generates the equivalent of roughly 2.3 million views every second across the platform.
- Shorts creators receive 45% of the revenue allocated to creators from the Shorts advertising revenue-sharing pool.
- Under the 2025 monetization structure, creators could qualify for full advertising revenue sharing with 1,000 subscribers and 10 million valid Shorts views within 90 days, subject to program requirements.
- Entry-level monetization features were available from 500 subscribers and 3 million Shorts views over 90 days, alongside other eligibility requirements.
- The platform reported more than 20 million video uploads per day overall in 2025, with Shorts forming a major part of an increasingly high-volume publishing environment.
- YouTube continued adding AI-assisted Shorts production tools in 2025 and 2026, increasing the number of ways creators can generate backgrounds, clips and visual elements directly within the format.
- Shorts now operates alongside long-form video rather than replacing it: YouTube still records more than 1 billion daily viewing hours on TVs, where longer programming plays a major role.
- Beginning in February 2027, newly applying creators will need 20 million qualified Shorts views in 90 days to qualify for ads and Premium revenue sharing, up from the previous 10 million threshold. The change was announced in August 2026 and does not affect creators already in the program.
Channel and Creator Statistics
- More than 3 million creators and channels participate in the YouTube Partner Program as of 2026.
- In early 2025, the program had gained approximately 700,000 channels in three years, illustrating the continued expansion of monetized creation.
- YouTube paid creators, artists and media companies more than $100 billion over the four years leading into late 2025 and 2026.
- In 2024 alone, YouTube’s creative ecosystem contributed an estimated $55 billion to U.S. GDP.
- The same U.S. creator ecosystem supported more than 490,000 full-time-equivalent jobs in 2024 through creator businesses and related economic activity.
- More than 100 million channels in India uploaded content during the year leading up to May 2025, showing the enormous scale of creator participation in YouTube’s largest audience market.
- More than 15,000 Indian channels had exceeded 1 million subscribers by May 2025.
- Creators in India received more than INR 21,000 crore from YouTube during the three years preceding May 2025.
- YouTube Shopping had more than 500,000 enrolled creators worldwide by July 2025.
- Gross merchandise value through YouTube Shopping increased 5X year over year by mid-2025, illustrating how creator businesses are expanding beyond advertising into commerce.
Subscriber Growth and Milestone Statistics
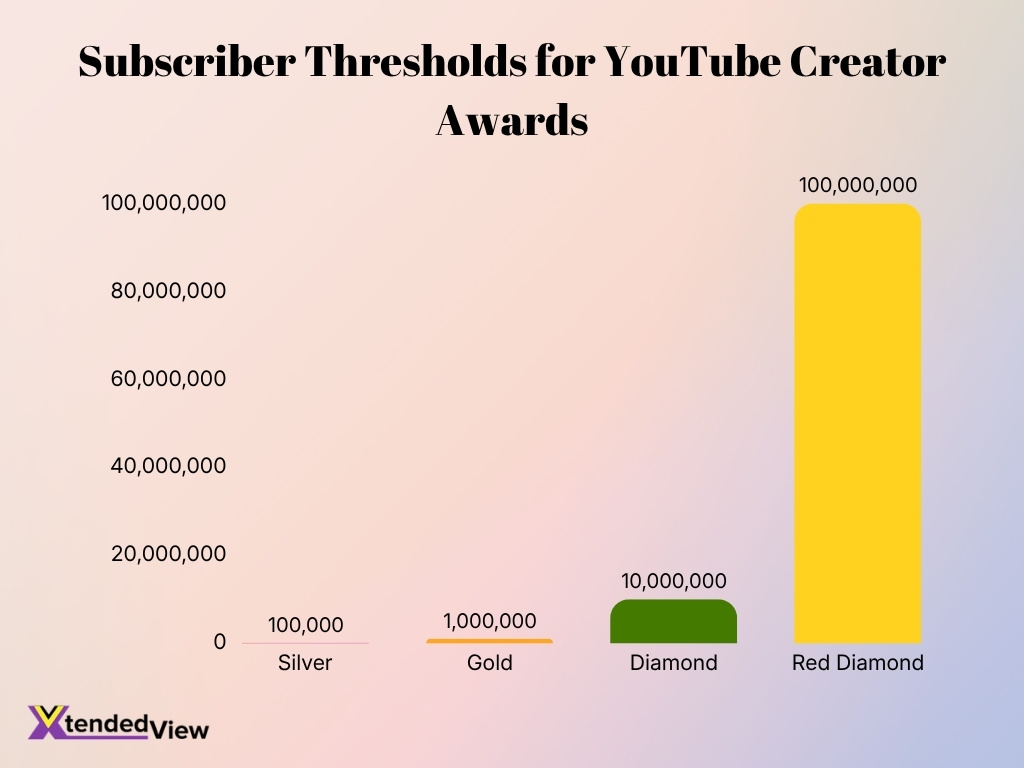
- The Silver Creator Award is presented to eligible channels reaching 100,000 subscribers.
- The Gold Creator Award celebrates channels that successfully cross the 1 million subscriber threshold.
- The Diamond Creator Award is reserved for elite channels achieving 10 million subscribers.
- The prestigious Red Diamond Creator Award honors channels amassing at least 100 million subscribers.
- In February 2026, BLACKPINK became the first official artist channel to reach 100 million subscribers.
- The artist’s channel simultaneously featured nine videos in the platform’s 1 Billion Views Club.
- By May 2025, India boasted more than 15,000 channels exceeding 1 million subscribers.
- The platform’s Partner Program added 700,000 channels over three years to hit 3 million participants in early 2025.
- Creators in a 2025 NFL campaign held a collective audience of nearly 695 million subscribers.
- Full ad-revenue eligibility in 2025 required 1,000 subscribers plus 4,000 watch hours or 10 million short-form views.
Revenue and Advertising Statistics
- YouTube generated approximately $40.4 billion in advertising revenue during 2025, based on reported quarterly results.
- First-quarter 2025 YouTube ad revenue reached $8.93 billion, up about 10% from $8.09 billion in Q1 2024.
- Second-quarter 2025 advertising revenue increased 13% year over year to $9.8 billion, driven primarily by direct-response advertising and then brand campaigns.
- Third-quarter 2025 YouTube advertising revenue climbed 15% to $10.3 billion.
- In the fourth quarter of 2025, ad revenue reached a quarterly record of $11.4 billion, 9% higher year over year despite comparison with elevated U.S. election advertising in Q4 2024.
- Across advertising and subscriptions combined, YouTube generated more than $60 billion in revenue in 2025, according to full-year results released in 2026.
- YouTube’s advertising revenue had already risen by approximately $4.6 billion from 2023 to 2024, with both brand and direct-response products contributing to growth.
- YouTube Shopping’s gross merchandise value grew fivefold year over year as of July 2025, adding commerce-driven revenue opportunities beyond conventional video ads.
- More than $100 billion was paid to creators, artists and media companies over four years, reflecting how advertising, subscriptions, commerce and other monetization products feed the broader creator economy.
- Connected TV also expands YouTube’s advertising opportunity: 56% of global marketers planned to increase OTT/CTV spending in 2025, compared with 53% in 2024.
Content and Video Statistics
- More than 20 billion videos had been uploaded to YouTube by its 20th anniversary in April 2025.
- Creators uploaded more than 20 million videos per day on average in 2025, covering Shorts, music, podcasts and conventional videos.
- At 20 million daily uploads, the platform receives roughly 833,000 videos per hour on an average day.
- The same rate equals approximately 13,900 video uploads per minute, illustrating the competition every new video faces for viewer attention.
- YouTube reported more than 1 billion monthly active viewers of podcast content in January 2025.
- Podcast consumption on living-room devices exceeded 700 million hours in October 2025, up from around 400 million hours a year earlier.
- That represents an increase of at least 75% in living-room podcast watch time within roughly one year.
- In April 2026 alone, YouTube Premium subscribers watched more than 800 million hours of podcast content.
- More than 2 billion logged-in viewers watch music videos each month, making music one of YouTube’s largest recurring content categories.
- Fan-made songs, memes and spinoff videos related to The Amazing Digital Circus collectively generated 25 billion views, compared with more than 300 million views for the original pilot, showing how one piece of content can trigger a much larger secondary content ecosystem.
Creator Earnings and Monetization
- YouTube has paid creators, artists and media companies more than $100 billion over the four years leading into 2025-26, showing the scale of its creator payout economy.
- Creators who monetize long-form Watch Page ads receive 55% of net advertising revenue generated from eligible ads on their public videos.
- Monetizing Shorts creators receive 45% of the revenue allocated to them from the Shorts Creator Pool, regardless of whether an eligible Short uses music.
- Eligible creators receive 70% of net revenue from channel memberships, Super Chat, Super Stickers, and Super Thanks under the current commerce terms.
- More than 50% of channels earning at least five figures annually on YouTube earned money from sources other than ads and YouTube Premium in 2024, illustrating the growing importance of diversified revenue.
- Channel memberships grew by more than 40% year over year in 2024, giving creators a larger recurring-revenue opportunity from loyal viewers.
- YouTube Shopping recorded 5X year-over-year GMV growth by July 2025 and had more than 500,000 creators enrolled globally.
- In March 2026, YouTube expanded its Shopping affiliate program to eligible Partner Program creators with as few as 500 subscribers, lowering the audience threshold for commerce revenue.
- In 2026, YouTube disclosed that creators earn more per user from Premium subscribers than from ad-supported viewers on average, adding weight to subscriptions as a creator revenue stream.
- Channels earning six figures or more from TV-screen viewing increased by over 45% in the year leading to October 2025, showing that connected-TV audiences can translate into meaningful creator income.
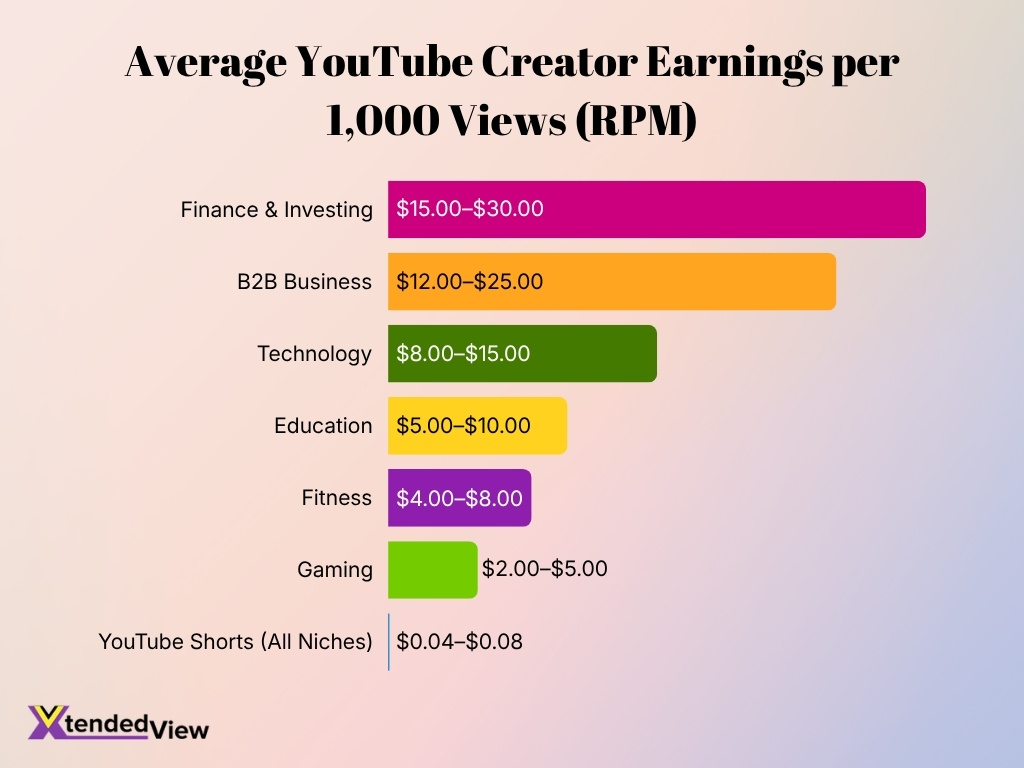
Average YouTube Creator Earnings per 1,000 Views by Niche
- Finance and investing generates the highest creator earnings, with an average RPM ranging from $15 to $30 per 1,000 views.
- B2B business content is another high-paying niche, producing an estimated $12 to $25 RPM.
- Technology creators can earn approximately $8 to $15 per 1,000 views, placing the niche among YouTube’s stronger monetization categories.
- Education content records an average RPM of $5 to $10, offering moderate earning potential compared with finance, business and technology.
- Fitness creators typically generate around $4 to $8 per 1,000 views, slightly below the education niche.
- Gaming content has a comparatively lower RPM of approximately $2 to $5 per 1,000 views, despite its large audience potential.
- YouTube Shorts generates substantially less revenue per 1,000 views, averaging just $0.04 to $0.08 RPM across niches.
- At the upper end, finance and investing’s $30 RPM can be roughly 375 times higher than the $0.08 upper-end RPM for YouTube Shorts, highlighting the significant monetization gap between niches and content formats.
Viewer Behavior and Engagement
- The recommendation system evaluates over 80 billion signals daily for personalization.
- Over 1 billion people consume podcast content on the platform every month.
- The platform remained the leading streaming service by TV watch time for over two consecutive years in 2025.
- Exactly 67% of viewers discussed videos with friends or family at least monthly in 2025.
- Among Gen Z audiences, 72% engage in monthly social discussions about videos.
- A massive 87% of U.S. viewers watched music-related programming during the preceding year.
- Over 20 million users utilized the Ask feature to learn more about videos in December 2025.
- More than 6 million viewers daily watched at least 10 minutes of automatically dubbed content.
Traffic Sources and Discovery on YouTube
- YouTube’s current recommendation engine processes more than 80 billion daily signals when determining what content may interest individual viewers.
- YouTube groups video-performance signals into three areas, appeal, engagement and satisfaction, when evaluating whether viewers are likely to enjoy a recommendation.
- The platform identifies at least eight major internal traffic-source categories, including Browse features, Suggested Videos, Search, video cards, advertising, product pages, remixed videos and Shorts sound pages.
- YouTube also tracks external traffic separately, including viewers arriving through websites, apps, embeds and links outside the platform.
- Search ranking relies heavily on three relevance elements: title, description and video content, plus engagement around the viewer’s search query.
- Recommendation reach can change because of three major external factors: topic interest, competition and seasonality.
- The Home feed mainly uses a viewer’s watch history, while Up Next gives greater weight to the video the person is currently watching.
- The recommendation system can carry audience signals across four major content formats: long-form videos, Shorts, livestreams and posts, although viewers do not necessarily consume every format equally.
- Creators can analyze discovery through reports for YouTube Search terms, Suggested Videos, playlists, external sources, and impressions-to-watch-time, providing several ways to identify which channels drive traffic.
- Search results are not ranked simply by total view count. Relevance to the query and engagement performance also influence which videos appear.
Business and Marketing Statistics
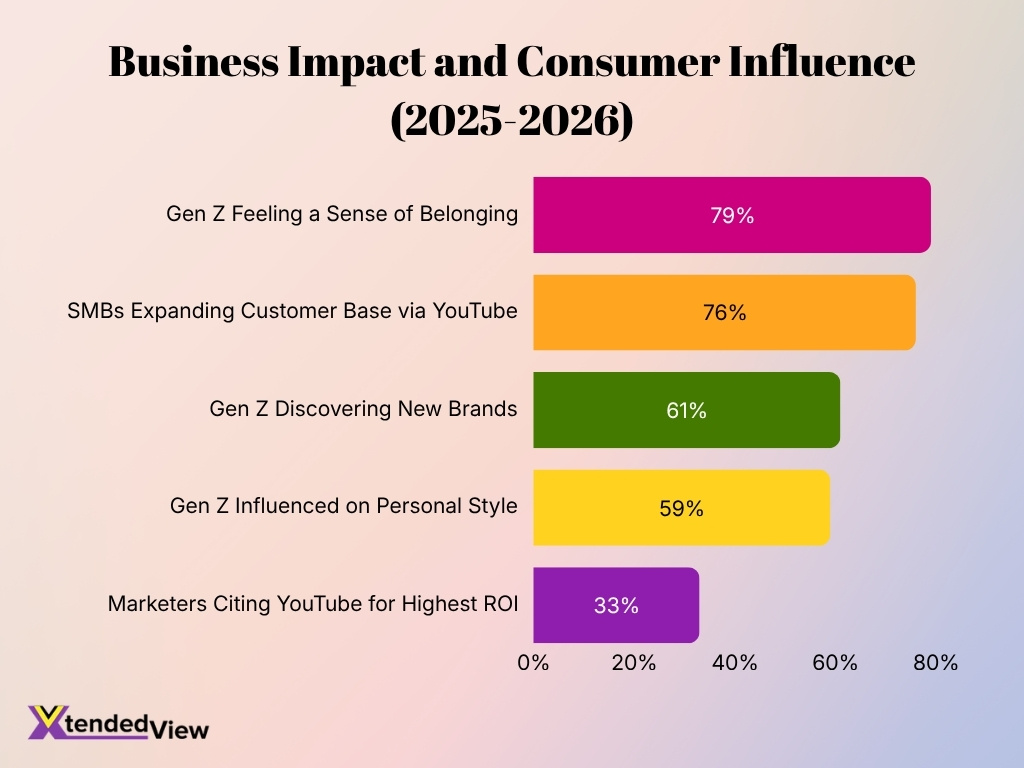
- In a September 2025 global survey of 1,505 B2B and B2C marketers, 33% identified YouTube as one of the social platforms delivering their highest ROI.
- In 2026 research, consumers exposed to creators discussing products on YouTube were 13X more likely to search for the brand than comparison audiences.
- The same 2026 research found viewers were 5X more likely to buy after creators discussed products on YouTube.
- 79% of Gen Z viewers said YouTube creators form communities that give them a sense of belonging, according to research cited in 2026.
- A 2025 U.S. survey found 61% of online Gen Z consumers ages 14-24 agreed that YouTube helped them discover brands or products they had not previously known about.
- Another 59% of online Gen Z respondents said content viewed online had influenced their personal style, showing how creator-led video can shape product preferences before purchase.
- Viewers were reported to be 98% more likely to trust creator recommendations on YouTube than creator recommendations elsewhere in late-2025 research cited by the platform.
- YouTube Shopping had more than 500,000 enrolled creators globally by July 2025, while gross merchandise value increased fivefold year over year.
- In the 2025 U.S. economic impact study, 76% of small and midsize businesses with a YouTube channel said the platform helped them expand their customer base by reaching new audiences.
- YouTube’s U.S. creative ecosystem contributed more than $60 billion to U.S. GDP in 2025 and supported more than 540,000 full-time-equivalent jobs, linking creator activity with wider business activity.
Premium and Music Statistics
- YouTube Music and YouTube Premium exceeded 125 million subscribers globally, including trial users, in March 2025.
- The 125 million total represented an increase of roughly 25 million subscribers from the 100 million subscriber milestone announced in early 2024, including trials.
- YouTube Premium Lite launched more broadly in the U.S. during 2025 at $7.99 per month, offering ad-free viewing for most videos while excluding some features included in the full Premium plan.
- More than 2 billion logged-in users watch music videos each month, giving artists access to an audience far larger than the platform’s paid subscriber base alone.
- YouTube paid more than $8 billion to the music industry during the 12 months from July 2024 through June 2025.
- The $8 billion music payout came from YouTube’s combined advertising and subscription model, rather than subscription fees alone.
- Podcasts have become particularly important among paid users: Premium subscribers watched more than 800 million hours of podcast content in April 2026.
- In 2026, YouTube reported that creators earned more per Premium user on average than per ad-supported user, demonstrating the financial importance of paid viewing.
- Under changes announced in 2026 for 2027, a pool equal to 30% of net Premium subscription revenue will fund eligible creator payouts, with distribution based on member viewing.
- The corresponding Premium Lite creator pool will represent 60% of net subscription revenue, with creators then receiving the applicable 55% long-form or 45% Shorts revenue share from their allocation.
Frequently Asked Questions (FAQs)
YouTube Shorts averages more than 200 billion views per day in 2026.
YouTube generated more than $60 billion in annual revenue from advertising and subscriptions combined in 2025.
YouTube accounted for 13.8% of U.S. TV watch time in June 2026, maintaining its lead among media distributors.
India ranks No. 1, with approximately 518 million people in YouTube’s advertising audience as of April 2026, followed by the U.S. with 259 million.
YouTube Music and Premium had more than 125 million subscribers globally, including trial users, with the milestone reported in 2025 and reiterated later that year.
Conclusion
YouTube Statistics show a platform that has developed far beyond its origins as a video-sharing website. It now operates simultaneously as a global entertainment service, television distributor, creator marketplace, advertising network, music platform, podcast destination, and commerce channel. Shorts exceeds 200 billion daily views, viewers watch more than 1 billion hours on television screens each day, and advertising plus subscription revenue surpassed $60 billion in 2025.
The platform’s creator economy has also become increasingly significant, with more than $100 billion paid to creators, artists and media companies over four years. At the same time, connected-TV viewing, subscriptions, shopping integrations, AI-assisted creation and short-form video continue to reshape how audiences discover and consume content. These trends suggest that YouTube’s growth depends less on any single content format and more on its ability to connect viewers, creators, advertisers and businesses across multiple screens, revenue models and forms of digital media.
