



Uber enters the year as a much larger and more diversified platform than the ride-hailing company it started as. The business now connects consumers with rides, restaurant delivery, grocery orders, retail delivery, freight services, and a growing network of autonomous vehicle partners. Its scale is substantial, with hundreds of millions of monthly users and billions of trips completed across its platform each quarter.
For consumers, Uber plays a practical role in daily commuting, airport transportation, late-night travel and local delivery. At the same time, restaurants, retailers, logistics companies and independent drivers use its network to reach customers, move goods and generate income. Uber is also investing heavily in electric vehicles, robotaxis and membership products as it looks for new ways to increase engagement and improve margins. The statistics in this article show how those businesses are performing, where growth is accelerating and which trends matter most.
Editor’s Choice
- 202 million: Uber finished 2025 with 202 million Monthly Active Platform Consumers, compared with 171 million one year earlier.
- $193.45 billion: Full-year Gross Bookings increased by roughly $30.7 billion between 2024 and 2025.
- $52.02 billion: Uber’s 2025 revenue rose 18% year over year, extending the company’s top-line growth.
- 13.57 billion: Consumers completed nearly 2.3 billion more trips in 2025 than they did in 2024.
- $9.76 billion: Uber generated almost $10 billion in free cash flow during 2025, up 42% from $6.90 billion in 2024.
- $1.92 billion: GAAP income from operations reached a quarterly record in Q1 2026, increasing 57% year over year.
- 50 million: Uber One reached 50 million members by Q1 2026, with members accounting for half of Mobility and Delivery Gross Bookings.
Recent Developments
- In March 2026, Uber announced an autonomous vehicle agreement that targets an initial 10,000 fully autonomous R2 robotaxis, with an option for as many as 40,000 additional vehicles in 2030. Initial deployments are planned for 2028.
- Under that agreement, Uber could invest up to $1.25 billion through 2031, subject to specified autonomous performance milestones.
- Another 2026 autonomous vehicle program aims to scale software-driven robotaxis across 28 cities globally by 2028, starting with Los Angeles and San Francisco in the first half of 2027.
- Uber’s first autonomous vehicle partnership for Japan includes a Tokyo robotaxi pilot targeted for late 2026, subject to discussions with authorities. The broader collaboration covers more than 10 planned cities worldwide.
- In June 2026, plans were announced for a commercial robotaxi pilot in Madrid. The program expects to add hundreds of robotaxis as operating milestones are reached.
- A separate June announcement identified Zurich as another European robotaxi market, with public operations expected later in 2026, subject to regulatory approval.
- Houston became the second planned market for the Lucid-Nuro-Uber robotaxi program, with commercial service targeted for mid-2027. A 50,000-square-foot depot has already been secured to support future fleet operations.
- By May 2026, autonomous vehicles from Uber and its partners were already available in parts of four U.S. cities: Atlanta, Austin, Dallas and Las Vegas, although they represented a small portion of the overall network.
Uber Company Overview
- Uber traces its founding to 2009 and incorporated as Ubercab, Inc. in Delaware in July 2010. It adopted the Uber Technologies, Inc. name in February 2011.
- The company reported approximately 34,000 employees worldwide as of Dec. 31, 2025.
- About 20,300 employees, or roughly 60% of the workforce, were located outside the United States at the end of 2025.
- Uber operated in more than 70 countries as of the end of 2025, highlighting the geographic reach of its platform.
- Its operations covered more than 15,000 cities worldwide by Dec. 31, 2025.
- Employee headcount rose from approximately 32,700 in June 2025 to 34,000 in December 2025, an increase of about 1,300 workers in six months.
- Uber’s workforce had already increased from approximately 31,500 employees in March 2025 to 32,700 by June, adding about 1,200 employees during that three-month period.
- By May 2026, Uber said its platform had facilitated more than 75 billion cumulative trips since the business began.
Uber Revenue Growth and Future Outlook
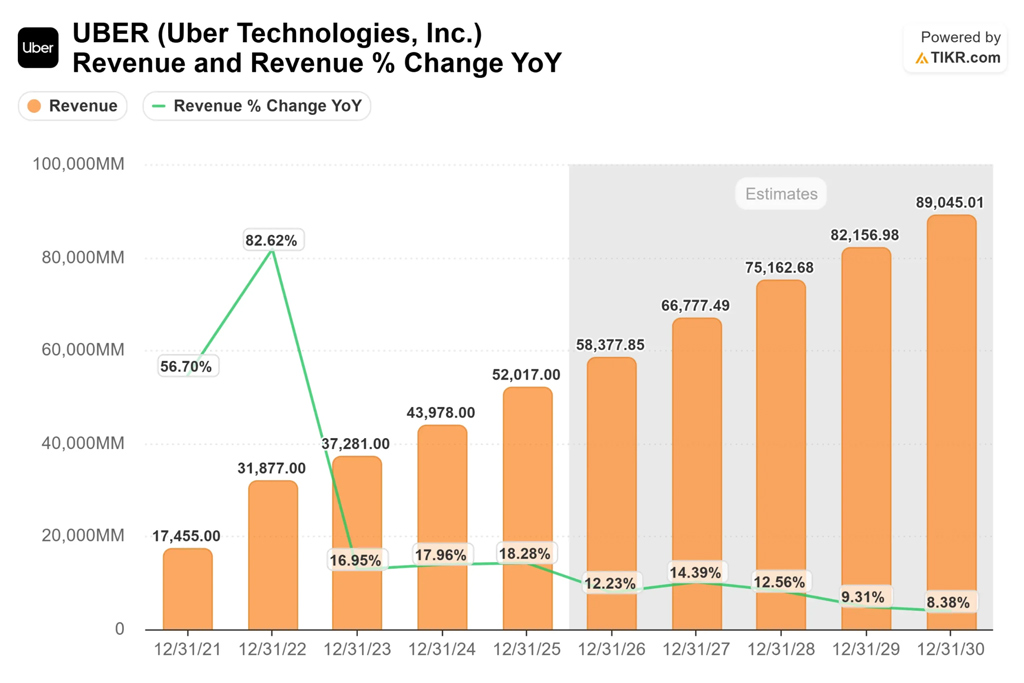
- Uber’s revenue increased from $17.46 billion in 2021 to $52.02 billion in 2025, representing nearly a threefold increase in four years.
- The company recorded its strongest annual growth in 2022, when revenue surged 82.62% YoY to reach $31.88 billion.
- Revenue growth moderated significantly in 2023, falling to 16.95% YoY, although total revenue still climbed to $37.28 billion.
- Uber maintained relatively consistent growth during 2024 and 2025, with revenue rising 17.96% and 18.28%, respectively.
- Revenue is estimated to reach $58.38 billion in 2026, reflecting a further 12.23% YoY increase from 2025.
- The forecast shows revenue accelerating slightly to $66.78 billion in 2027, supported by estimated annual growth of 14.39%.
- By 2028, Uber’s revenue is projected to surpass $75 billion, reaching approximately $75.16 billion with 12.56% YoY growth.
- Growth is expected to slow to single digits by 2029, with revenue forecast at $82.16 billion and annual growth of 9.31%.
- By 2030, Uber’s annual revenue could reach approximately $89.05 billion, although YoY growth is projected to moderate further to 8.38%.
- Overall, the data suggests Uber is entering a higher-revenue but slower-growth phase, with revenue projected to rise consistently through 2030 despite declining percentage growth rates.
Uber Gross Bookings Statistics
- Uber recorded $193.45 billion in Gross Bookings in 2025, up from $162.77 billion in 2024.
- Full-year Gross Bookings grew 19% on a reported basis and 20% in constant currency during 2025.
- The increase between 2024 and 2025 amounted to approximately $30.68 billion in additional annual Gross Bookings.
- Q4 2025 Gross Bookings reached $54.14 billion, 22% higher than the $44.20 billion generated in Q4 2024.
- Mobility accounted for $27.44 billion of Q4 2025 Gross Bookings, up 20% from $22.80 billion in the comparable 2024 quarter.
- Delivery generated $25.43 billion in Q4 2025 Gross Bookings, increasing 26% from $20.13 billion a year earlier.
- Q1 2026 total Gross Bookings climbed to $53.72 billion, a 25% reported increase from $42.82 billion in Q1 2025. Constant-currency growth was 21%.
- Q1 2026 Mobility Gross Bookings reached $26.39 billion, increasing 25% year over year, while Delivery Gross Bookings rose 28% to $25.99 billion.
- Freight Gross Bookings totaled $1.33 billion in Q1 2026, up 6% from $1.26 billion in Q1 2025.
- For Q2 2026, management initially projected Gross Bookings of $56.25 billion to $57.75 billion, implying 18% to 22% year-over-year constant-currency growth.
Uber Profit and Earnings Statistics
- Uber reported $10.05 billion in GAAP net income attributable to the company in 2025, compared with $9.86 billion in 2024.
- GAAP income from operations nearly doubled, rising 99% to $5.57 billion in 2025 from $2.80 billion in 2024.
- Adjusted EBITDA increased 35% to $8.73 billion in 2025, compared with $6.48 billion a year earlier.
- Net cash provided by operating activities rose 42% to $10.10 billion in 2025, up from $7.14 billion in 2024.
- Free cash flow increased 42% to $9.76 billion in 2025, compared with $6.90 billion in 2024.
- Q1 2026 GAAP income from operations climbed 57% to $1.92 billion, compared with $1.23 billion in Q1 2025.
- Q1 2026 Adjusted EBITDA increased 33% to $2.48 billion, while its margin as a share of Gross Bookings improved to 4.6% from 4.4% a year earlier.
- Q1 2026 non-GAAP net income reached $1.49 billion, increasing 39% from $1.07 billion in Q1 2025. Non-GAAP EPS rose 44% to $0.72.
- GAAP net income fell to $263 million in Q1 2026 from $1.78 billion in Q1 2025, largely reflecting a $1.5 billion pre-tax headwind from revaluations of equity investments.
- Uber generated $2.29 billion in free cash flow during Q1 2026, compared with $2.25 billion in Q1 2025, while operating cash flow reached $2.35 billion.
Uber Monthly Active Users
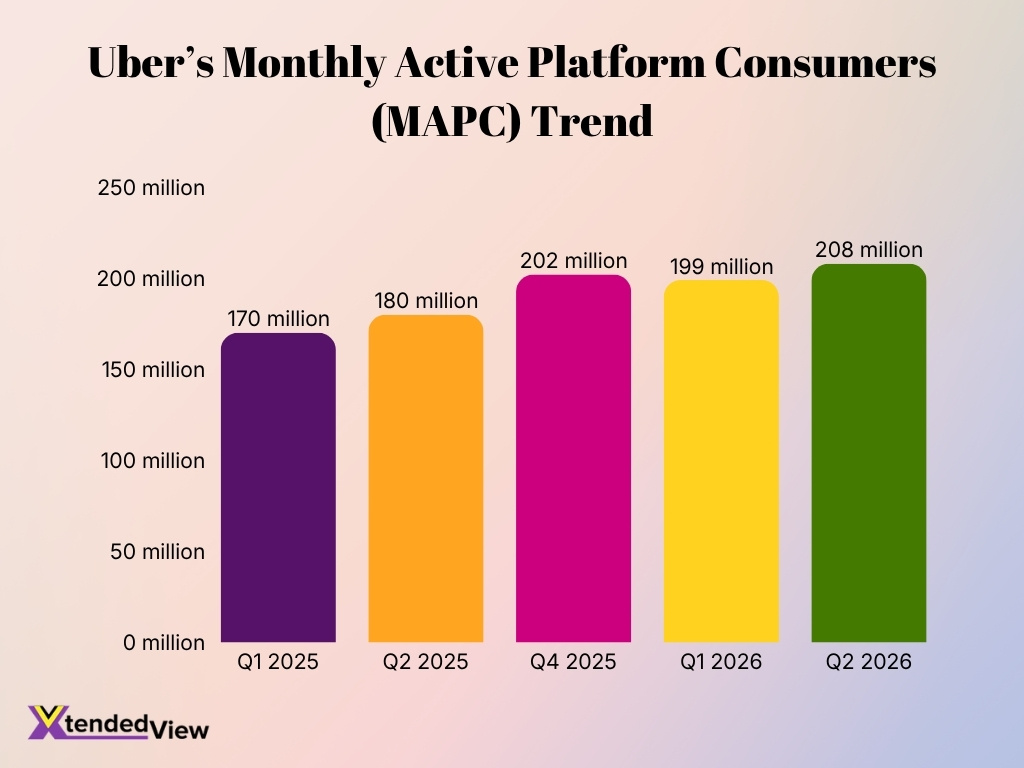
- Uber reached a record 208 million MAPCs in Q2 2026, up 16% from 180 million in Q2 2025.
- In Q1 2026, Uber averaged 199 million MAPCs, 17% more than the 170 million recorded in Q1 2025.
- The platform ended 2025 with 202 million MAPCs, setting a year-end record and crossing the 200 million mark.
- Uber had 180 million MAPCs in Q2 2025, representing 15% year-over-year growth at the time.
- Q1 2025 MAPCs increased 14% year over year, helping drive an 18% rise in quarterly trips.
- MAPCs grew by about 9 million between Q1 and Q2 2026, from 199 million to 208 million.
- Uber’s Q2 2026 user base was approximately 38 million larger than its Q1 2025 base of 170 million.
- User engagement also increased. Monthly trips per MAPC grew 2% year over year in Q2 2026, indicating that growth came from both a larger audience and slightly higher usage per consumer.
- Uber finished 2025 at 6.2 monthly trips per MAPC, alongside record year-end consumer numbers.
Uber Trips and Rides Statistics
- Uber users completed 3.87 billion trips in Q2 2026, up 18% from 3.27 billion in Q2 2025.
- Q1 2026 generated approximately 3.64 billion trips, representing 20% year-over-year growth.
- Uber therefore handled roughly 7.5 billion trips during the first half of 2026 when Q1 and Q2 volumes are combined.
- Trip growth in Q2 2026 came from a 16% rise in MAPCs and a 2% increase in monthly trips per consumer.
- Q2 2025 had generated 3.27 billion trips, an 18% increase from the comparable quarter of 2024.
- Q1 2025 reached 3.04 billion trips, also up 18% year over year.
- The difference between Q2 2025 and Q2 2026 amounts to nearly 599 million additional trips in one quarter.
- Between Q1 and Q2 2026, quarterly trip volume increased by approximately 230 million trips, or about 6%.
- Uber reported that its platform had facilitated more than 75 billion cumulative trips by May 2026, showing the scale reached since its launch.
- Full-year 2025 trip volume grew 20%, while year-end monthly trips per consumer reached 6.2.
Uber Drivers and Couriers Statistics
- Independent 2026 analysis found that the typical Uber driver generated about $23.88 per active hour during 2025.
- The same dataset placed average Uber driver activity at about 21.2 active hours per week.
- Those hours translated into approximately $522 in weekly gross earnings for the average Uber driver in the dataset.
- Across the broader U.S. rideshare sector, driver gross pay per trip increased just 3.6% in 2025, despite faster growth in customer prices.
- Rideshare gross pay per hour rose 4.1% during 2025, again trailing the increase in fares paid by consumers.
- Average rideshare bonus earnings climbed 32.9% year over year, from $238.97 in Q4 2024 to $317.65 in Q4 2025.
- Average rideshare tips reached a record $1.58 per trip during the period measured in the 2026 industry report.
- Idle driving represented roughly 30% of total miles traveled by drivers in the 2025 dataset, highlighting the unpaid distance that can affect net earnings after fuel and vehicle costs.
- For comparison, Uber drivers’ average weekly earnings had fallen 3.4% to $513 in 2024, while their working hours increased 0.8%.
- A longitudinal study covering 1.5 million Uber trips from 258 U.K. drivers found lower driver pay and longer waiting periods after the introduction of dynamic pricing in the dataset studied.
Uber Rider Age Demographics in Mumbai
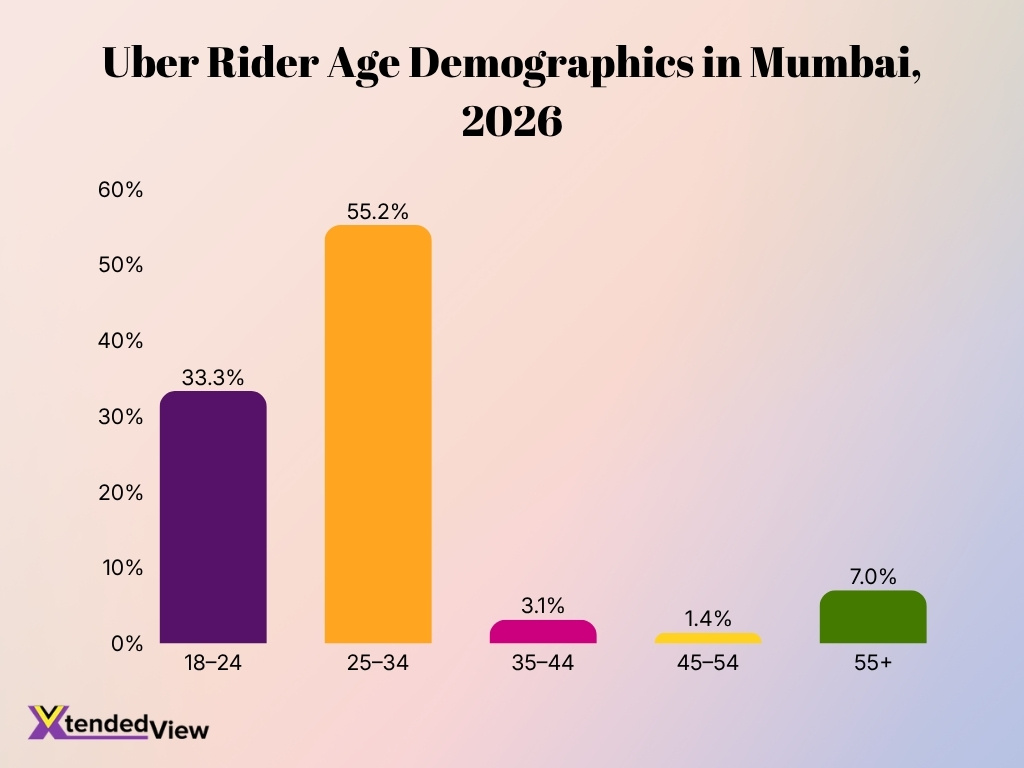
- The 25–34 age group represents the largest share of Uber riders in Mumbai, accounting for 55.2% of the total.
- Riders aged 18–24 form the second-largest demographic, making up a substantial 33.3% of Uber users.
- Together, riders aged 18–34 account for 88.5% of the surveyed rider base, highlighting Uber’s strong appeal among younger adults.
- The 55+ age group represents 7.0% of riders, making it the largest segment among users aged 35 and above.
- Riders aged 35–44 account for just 3.1%, indicating a sharp decline in usage beyond the 25–34 age bracket.
- The 45–54 age group has the smallest share at only 1.4% of Uber riders.
- Overall, the data shows that Uber ridership in Mumbai is heavily concentrated among younger consumers, particularly those between 18 and 34 years old.
Uber Driver Demographics and Earnings Statistics
- Average Uber driver gross earnings reached about $23.88 per active hour in 2025.
- Weekly earnings averaged $522 before operating expenses for 21.2 active hours of work.
- Average weekly earnings in 2024 were approximately $513, representing a 3.4% decline.
- Gross driver pay per hour increased 4.1% in 2025, while rider prices increased almost 10%.
- Driver pay per trip increased 3.6%, which was significantly below the 33.2% increase in platform fees.
- Average driver bonuses were $317.65 in Q4 2025, compared to $238.97 in Q4 2024.
- Average tips reached $1.58 per trip, marking the highest level recorded in recent analysis.
- Hourly driver pay in 2025 fell 6.9% in San Francisco, 5.3% in Austin, and 4.7% in Los Angeles.
- Late-evening and overnight drivers consistently earned higher per-trip and hourly rates.
- Analysis of 76,000 trips revealed significant differences between rider fares and actual worker earnings.
Uber Eats Statistics
- Uber Delivery generated $28.04 billion in Gross Bookings in Q2 2026, representing 27% reported growth and 25% constant-currency growth year over year.
- In Q1 2026, Delivery Gross Bookings reached approximately $25.99 billion, up 28% on a reported basis and 23% in constant currency.
- Combined Delivery Gross Bookings therefore exceeded $54 billion in the first half of 2026.
- Delivery revenue reached roughly $5.07 billion in Q1 2026, increasing 34% from the corresponding quarter in 2025.
- Delivery Segment Operating Income reached $961 million in Q1 2026, an increase of $290 million from the prior-year quarter.
- Delivery Gross Bookings increased 22% in constant currency for full-year 2025, outpacing the 19% growth recorded by Mobility.
- U.S. transaction data placed Uber Eats at approximately 23% of observed restaurant-delivery sales in the most recent directly published benchmark, ranking it second in that dataset.
- Uber Eats has also strengthened its position outside the U.S. In the U.K., one 2026 market analysis estimated its share had risen from 22.3% in 2024 to 29.7% in 2026.
- Uber expanded its delivery automation strategy again in August 2026 through a drone-delivery partnership that targets initial U.S. service in Dallas and Houston by the end of 2026.
- The drone collaboration has a long-term target of reaching 1 million deliveries per day by 2029, showing how Uber plans to combine human couriers, sidewalk robots and aerial delivery within the Uber Eats network.
India Ride-Hailing Market Share Statistics
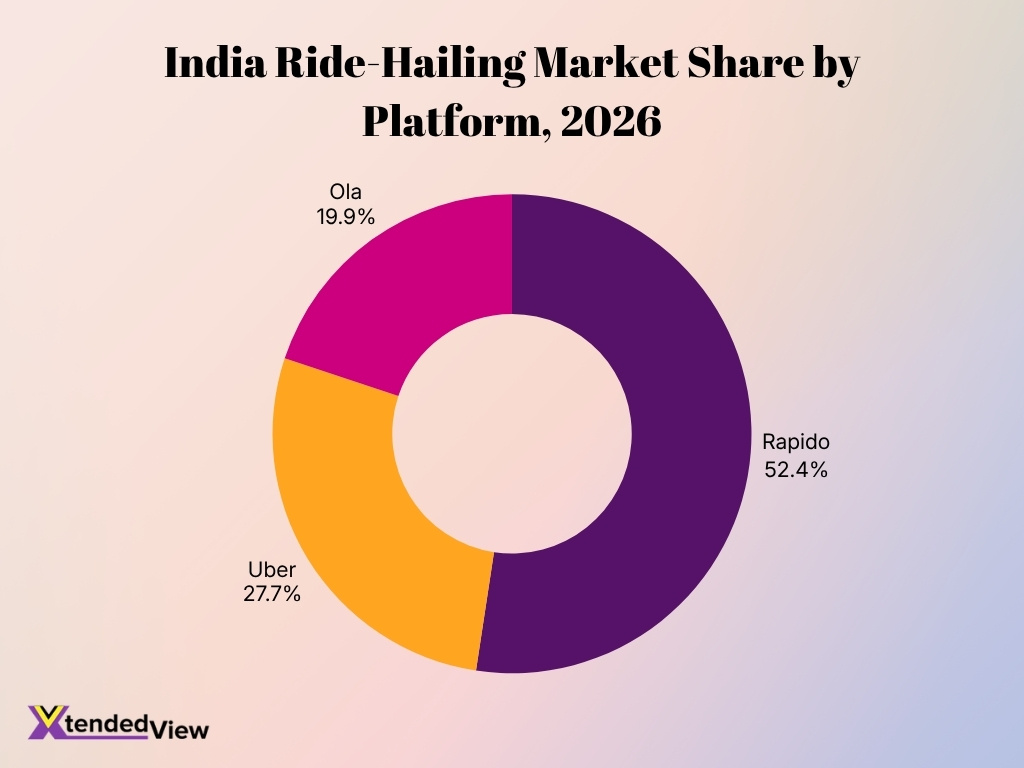
- Rapido leads India’s ride-hailing market with a 52.4% share of monthly active users in January-February 2026.
- Uber ranks second with a 27.7% market share, accounting for more than one-quarter of active ride-hailing users.
- Ola holds 19.9% of the market, placing it third among the three major ride-hailing platforms.
- Rapido’s 52.4% share is nearly double Uber’s 27.7%, highlighting its strong position in India’s ride-hailing market.
- Rapido and Uber together account for 80.1% of monthly active users, indicating that usage is heavily concentrated among the two leading platforms.
- Uber’s market share is 7.8 percentage points higher than Ola’s, while Rapido leads Uber by 24.7 percentage points.
- The three platforms collectively represent 100% of the measured market share, with Rapido alone accounting for more than half of monthly active users.
Uber One Membership Statistics
- Uber One reached 50 million members in Q1 2026, up from 46 million at the end of 2025.
- Uber One had 46 million members at the end of Q4 2025, representing 55% year-over-year membership growth.
- Membership increased by approximately 4 million between Q4 2025 and Q1 2026, equivalent to nearly 9% sequential growth.
- Uber One members accounted for about 50% of combined Mobility and Delivery Gross Bookings by Q1 2026.
- Uber One had more than 36 million members by June 2025, meaning membership expanded by roughly 14 million before reaching the 50 million milestone.
- Uber One membership increased about 60% year over year in June 2025, showing rapid adoption before the program crossed 50 million subscribers.
- Uber reported that consumers who use more than one platform service have 35% higher retention and spend roughly three times more than other users.
- Only about 20% of active consumers in markets offering both rides and delivery used both categories in late 2025, leaving substantial room for cross-platform membership growth.
- In 2026, Uber One expanded its travel proposition by offering members at least 20% off selected hotel inventory and 10% back in Uber Credits on qualifying hotel bookings.
- The selected hotel discount covered approximately 10,000 hotels, while Uber’s new booking integration provided access to more than 700,000 hotel properties worldwide.
Uber Freight Statistics
- Uber Freight generated $1.57 billion in Gross Bookings in Q2 2026, up 25% from $1.26 billion in Q2 2025.
- Freight revenue reached $1.58 billion in Q2 2026, increasing 26% from $1.26 billion one year earlier.
- Freight added approximately $311 million in quarterly Gross Bookings between Q2 2025 and Q2 2026.
- Quarterly Freight revenue increased by $322 million year over year in Q2 2026.
- Freight Gross Bookings grew 25% because of increases in both booking value per trip and trip volume.
- During the first six months of 2026, Freight revenue rose 16% year over year, an increase of $399 million.
- First-half Freight Gross Bookings also grew 16%, supported by higher revenue per trip and greater shipment volume.
- Freight recorded a $24 million segment operating loss in Q2 2026, compared with roughly $26 million in the prior-year quarter.
- The Freight operating loss narrowed by 8% year over year during Q2 2026 despite a $320 million increase in carrier payments.
- Freight Gross Bookings increased from $1.33 billion in Q1 2026 to $1.57 billion in Q2, a sequential gain of about 18%.
Most Valuable and Strongest Mobility Brands
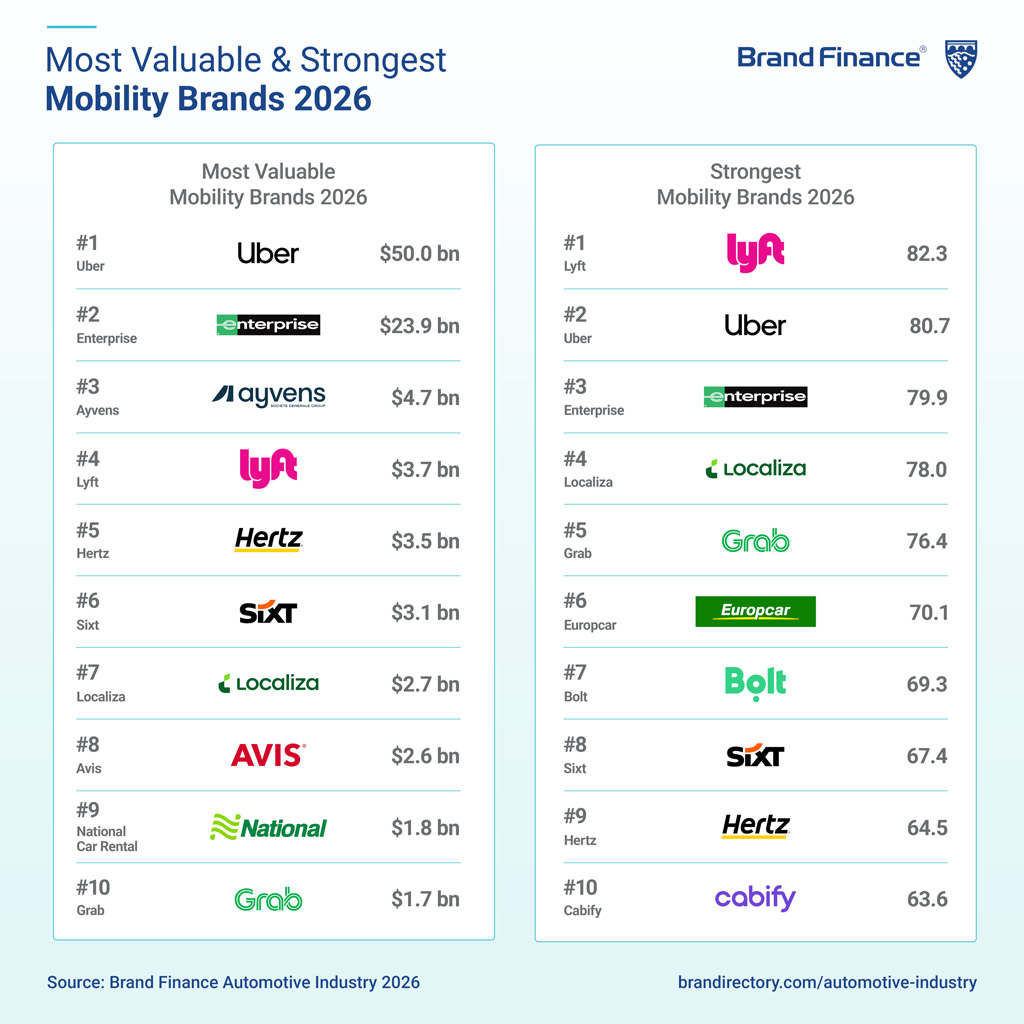
- Uber ranked as the world’s most valuable mobility brand in 2026, with a brand value of $50.0 billion, more than double that of its nearest competitor.
- Enterprise secured second place with a brand value of $23.9 billion, followed by Ayvens at $4.7 billion.
- Uber’s $50 billion valuation was nearly 10.6 times higher than Ayvens, the third-most valuable mobility brand.
- Lyft ranked fourth by brand value at $3.7 billion, while Hertz followed closely in fifth place at $3.5 billion.
- Sixt, Localiza and Avis recorded brand values of $3.1 billion, $2.7 billion and $2.6 billion, respectively.
- National Car Rental and Grab completed the top 10 most valuable mobility brands, valued at $1.8 billion and $1.7 billion, respectively.
- In brand strength, Lyft took the top position with a score of 82.3, outperforming Uber despite having a significantly lower brand value.
- Uber was the second-strongest mobility brand with a score of 80.7, while Enterprise ranked third with 79.9.
- Localiza and Grab placed fourth and fifth for brand strength, scoring 78.0 and 76.4, respectively.
- The rankings highlight Uber’s dominant position in 2026, as it was #1 in brand value and #2 in brand strength, giving it a leading position across both measures.
Uber Mobility and Delivery Segment Statistics
- Mobility Gross Bookings reached $28.99 billion in Q2 2026, up 22% from $23.76 billion in Q2 2025.
- Delivery Gross Bookings increased 26% to $27.46 billion in Q2 2026 from $21.73 billion a year earlier.
- Combined Mobility and Delivery Gross Bookings totaled approximately $56.45 billion in Q2 2026.
- Mobility revenue was $7.36 billion in Q2 2026, only 1% higher than $7.29 billion in Q2 2025 because business-model changes affected reported revenue.
- Delivery revenue rose 28% to $5.25 billion in Q2 2026, compared with $4.10 billion in the same quarter of 2025.
- Delivery therefore added approximately $1.14 billion in quarterly revenue year over year, compared with a $75 million increase for Mobility.
- Mobility Segment Operating Income increased 28% year over year in Q2 2026, supported by higher bookings and lower driver payments related to business-model changes.
- Delivery Segment Operating Income increased 38% in Q2 2026, rising by $289 million from the year-earlier quarter.
- For the first half of 2026, Delivery revenue grew 31%, while Mobility revenue increased 3% on a reported basis.
- Q2 2026 Mobility and Delivery growth helped push total company Gross Bookings to $58.02 billion, 24% above the $46.76 billion reported in Q2 2025.
Uber App and Download Statistics
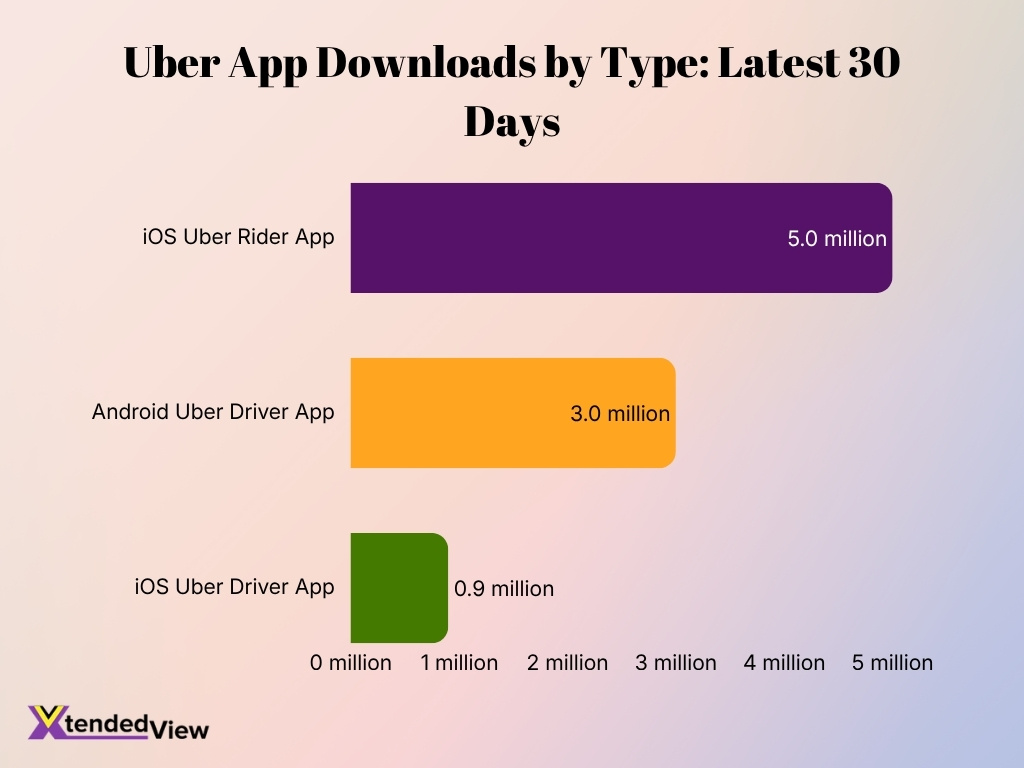
- The main Uber rider app generated an estimated 5 million worldwide downloads in the latest monthly period available in 2026.
- Across Uber’s iOS app portfolio, total worldwide downloads reached roughly 8 million over the latest 30-day period measured in 2026.
- The Uber rider app accounted for around 62.5% of those 8 million iOS portfolio downloads, based on the 5 million estimate for the core app.
- Uber’s Android Driver app generated an estimated 3 million downloads in the latest measured month in 2026.
- The iOS version of the Uber Driver app recorded approximately 900,000 downloads in its latest measured month.
- The U.S. Uber rider app held a 4.9 out of 5 rating from roughly 17 million ratings on iOS in August 2026.
- The Uber rider app ranked No. 1 in the U.S. Travel category on iOS at the time of measurement.
- The iOS rider app supports English plus 49 additional languages, reflecting the platform’s international consumer base.
- Uber’s iOS rider app first launched in May 2010, giving the product more than 16 years of mobile-market history by 2026.
- Mobile engagement now supports a platform averaging 208 million monthly active consumers and 3.87 billion quarterly trips, illustrating how app adoption converts into large-scale transactions.
Uber Autonomous and Electric Vehicle Statistics
- More than 339,000 zero-emission vehicle drivers were active on Uber in Q1 2026, 47% more than in Q1 2025.
- Zero-emission drivers completed more than 154 million Uber trips in Q1 2026, also up 47% year over year.
- That Q1 volume equaled almost 20 zero-emission Uber trips every second worldwide.
- Zero-emission vehicles accounted for 17.9% of Uber’s on-trip miles in Europe during Q1 2026.
- In the U.S. and Canada, ZEVs accounted for 9.1% of Uber on-trip miles in Q1 2026.
- Some cities, including London and Amsterdam, had already crossed 40% zero-emission on-trip miles on Uber by early 2026.
- Passenger carbon intensity declined 19% in Europe between 2021 and 2025, reaching 186 grams of CO₂ per passenger mile in 2025.
- U.S. and Canadian passenger carbon intensity fell 12% from 2021 to 2025, reaching 318 grams of CO₂ per passenger mile.
- Uber said in 2026 that it was working with more than 20 autonomous vehicle companies, using partnerships rather than developing one proprietary self-driving system.
- Uber plans to have autonomous vehicles operating through its platform in 15 markets by the end of 2026, while management has discussed committing about $10 billion to autonomous technology and deployment over time.
Frequently Asked Questions (FAQs)
Uber generated $52.02 billion in revenue in 2025, an 18% increase from $43.98 billion in 2024.
Uber recorded 13.57 billion trips in 2025, up 20% from 11.27 billion trips in 2024.
Uber reported $193.45 billion in Gross Bookings in 2025, representing 19% reported growth and 20% constant-currency growth.
Uber One reached 50 million members in Q1 2026, with members accounting for half of Gross Bookings across Mobility and Delivery.
More than 339,000 zero-emission vehicle drivers were active on Uber in Q1 2026, up more than 47% year over year. These drivers completed over 154 million trips during the quarter.
Conclusion
Uber’s statistics show a company that now extends well beyond ride-hailing. Mobility remains its largest booking category, but Delivery, Uber One, Freight, electric vehicles and autonomous vehicle partnerships increasingly shape the company’s growth strategy. The platform has also continued to expand its user base, trip volume and booking value while improving operating profitability.
With 208 million monthly active consumers, billions of quarterly trips and tens of billions of dollars in quarterly Gross Bookings, Uber operates at a scale that few mobility platforms can match. Delivery continues to grow faster than Mobility in percentage terms, while Uber One strengthens customer retention and cross-platform spending. Meanwhile, the company’s expanding EV and autonomous vehicle programs show how it is preparing for changes in transportation economics.
The next stage of Uber’s growth will depend on how effectively it converts this scale into sustainable earnings while maintaining attractive pricing for riders, competitive earnings for drivers and strong value for merchants. Its performance suggests that the company is increasingly balancing growth with profitability, even as competition, regulation and automation continue to reshape the global mobility and delivery markets.
