
The conversational AI formerly known as Google Bard (now often branded as Google Gemini) is shaping how individuals and businesses engage with language models and generative assistants. From helping marketing teams draft copy to enabling developers to debug code snippets, this tool is being adopted in real‑world settings across industries. For example, a U.S. customer‑service team uses Bard to triage support tickets, and a global publishing house uses it to surface content ideas for niche markets. This article delves into hard statistics and trends behind Bard’s usage, exploring further to see what the numbers reveal.
Editor’s Choice
- In January 2025, Gemini logged approximately 267.6 million visits, up 2.4% from December 2024.
- In February 2025, total visits rose to around 284.1 million (desktop 193.3 million, mobile 90.8 million).
- As of March 2025, estimated monthly active users reached 350 million, with daily active users around 35 million.
- The U.S. accounted for approximately 15.99% of traffic in early 2025, and India followed with around 10.17%.
- Age group 25‑34 made up about 31.1% of visitors.
- Traffic channel breakdown, about 76.7% from direct visits, 16.8% from organic search.
- Each AI query costs (estimated) around $0.006 to $0.031 for Google.
Recent Developments
- The product originally launched as Bard in early 2023 and was rebranded to Gemini on February 8, 2024.
- In February 2024, Google expanded availability to mobile apps and introduced paid versions of the service.
- The model now supports more than 230 countries/territories and over 40–46 languages.
- In 2025, Gemini introduced enhanced reasoning and multimodal features designed to handle text + image inputs.
- Google integrated Gemini more deeply into its ecosystem, including accessibility via Android default assistants and via the Google app on iOS.
- Internal documents revealed that Google used comparisons with ChatGPT outputs to refine Gemini’s responses.
- Due to a high‑profile error during a demo, Google adjusted its rollout strategy, promoting Bard as a “research preview” in its early stage.
- Regulatory scrutiny grew around AI‑assistant integration and dominance within the search ecosystem.
How Many People Use Google Bard?
- An estimated 350 million monthly active users (MAU) by March 2025.
- Daily active users (DAU) are estimated at around 35 million in early 2025.
- In January 2025 alone, visits reached about 267.6 million.
- In February 2025, visits were approximately 284.1 million.
- One source estimates “active users” at roughly 47 million in 2025.
- Estimates suggest the user base could exceed 1 billion in the future, though not yet been achieved.
- According to a market‑share survey, about 4% of global chatbot users chose Bard/Gemini.
- As of 2024, about 1 in 8 people worldwide used Bard for their search queries.
General Google Bard Statistics
- The training dataset size included approximately 750 GB of data (or 1.56 trillion words) during a key phase.
- The underlying model reportedly had 137 billion parameters in an early version.
- User gender breakdown (estimated), 60% male / 40% female.
- Average session length for users is 4 minutes 40 seconds.
- Estimated cost per query, $0.006 to $0.031.
- Model availability has been extended to over 230 countries/territories.
- Monthly visits exceeded 140 million by late 2023.
- In 2025, mobile visits for Gemini in one month reached 90.83 million (February) on a total of 284.1 million visits.
- Bounce rate for mobile users in February 2025 was 44.78%, desktop 27.10%.
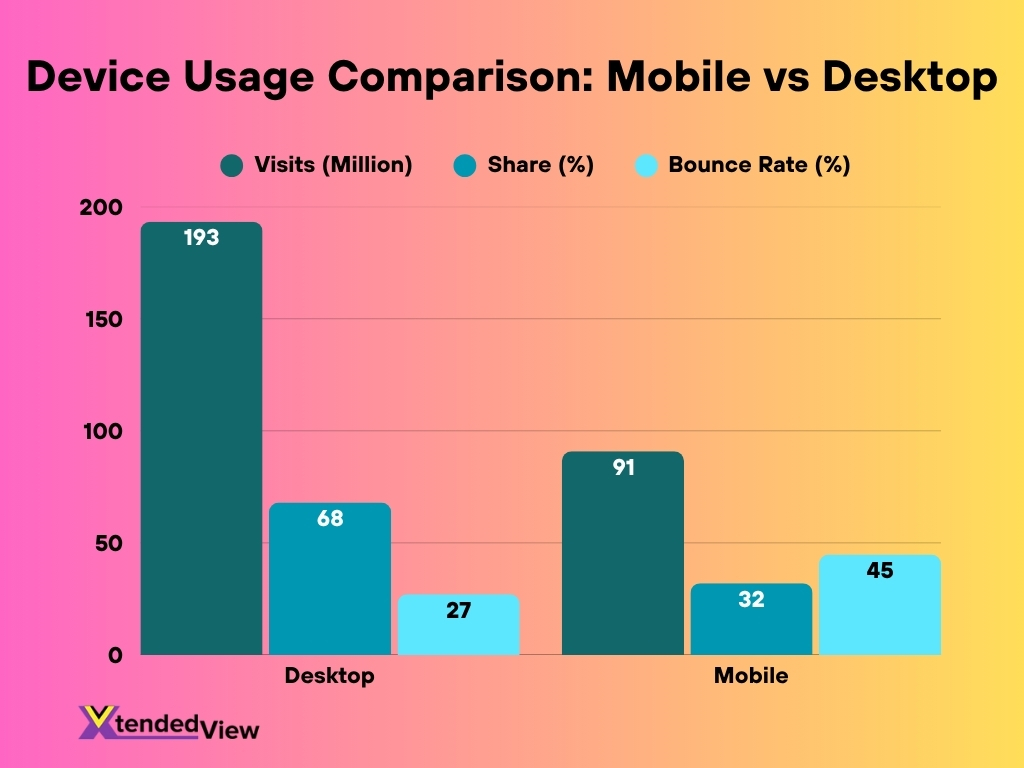
Google Bard Web Traffic Statistics
- In February 2025, the platform recorded 284.1 million total visits, with 193.3 million via desktop and 90.83 million via mobile.
- The bounce rate for mobile users in February 2025 was 44.78%, while desktop users had 27.1%.
- Average pages per visit in that month stood at 3.2 pages, with mobile sessions slightly higher than desktop.
- The average visit duration was around 4 minutes and 40 seconds globally.
- Unique visitors in February 2025 numbered approximately 67.3 million.
- Direct traffic accounted for 74% of visits, organic search 15%, with social and referrals making up the rest.
- Desktop share of traffic was 68%, mobile 32% for that time period.
- In one ranking, the site achieved 1.1 billion visits in a recent month (late 2025), reflecting rapid growth.
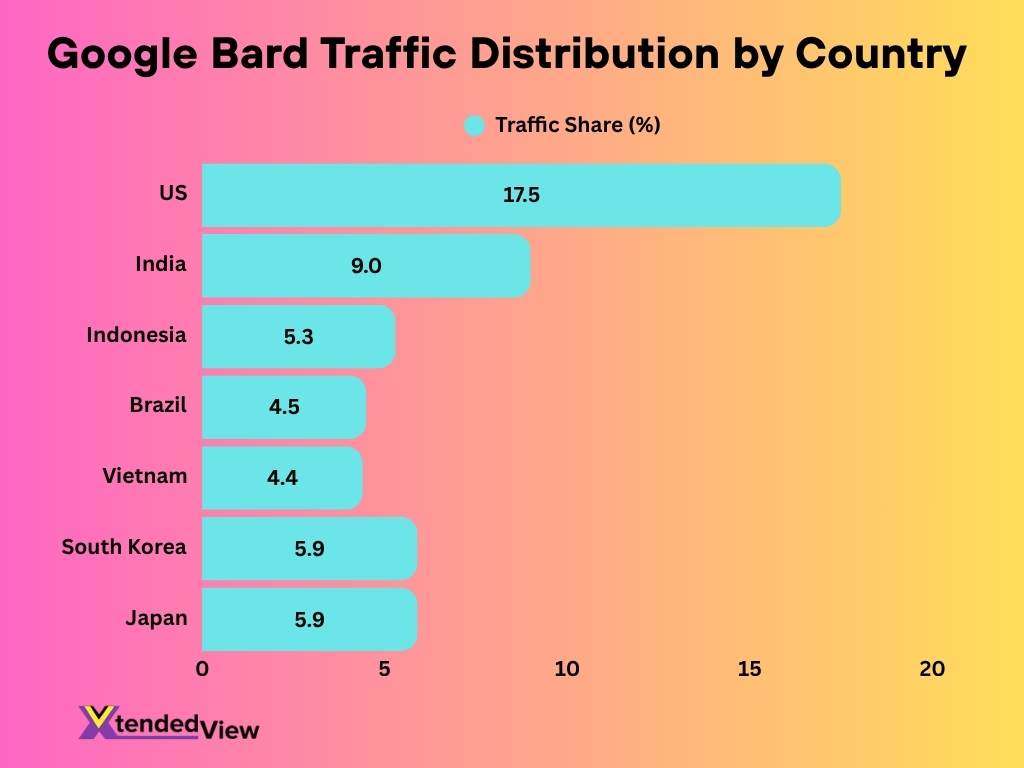
Google Bard Traffic by Country
- The United States contributed approximately 17.5% of the global traffic share in early 2025.
- India followed with around 9.0% of traffic share.
- Indonesia accounted for 5.3%, Brazil 4.5%, and Vietnam 4.4% of traffic.
- In another set of data: U.S. 15.94%, India 10.38%, Indonesia 4.25%, remainder 59.3% from other regions.
- Country‑distribution analysis showed South Korea 5.9%, Japan 5.9%, in one dataset.
- Global availability spans 200+ countries/territories, ensuring a wide geographic reach.
- Emerging markets (India, Southeast Asia) represent growing shares of new traffic.
- Localization and mobile‑first rollout in non‑English markets support increasing traffic diversity.
Google Bard Traffic by Source
- As of February 2025, 76% of traffic came from direct visits.
- 16.77% of traffic arrived via organic search.
- Social media referrals accounted for approximately 54.72% of the social‑traffic share.
- Desktop bounce rate in February 2025 was about 27.1%, mobile 44.78%.
- Unique desktop visitors in Feb 2025 were 40.35 million, up from 36.33 million in December 2024.
- Unique mobile visitors dropped slightly from 27.33 million in December 2024 to 26.94 million in February 2025.
- In May 2025, monthly visits exceeded 400 million.
- Gemini’s share among global chatbot traffic sources was 4% in 2025.
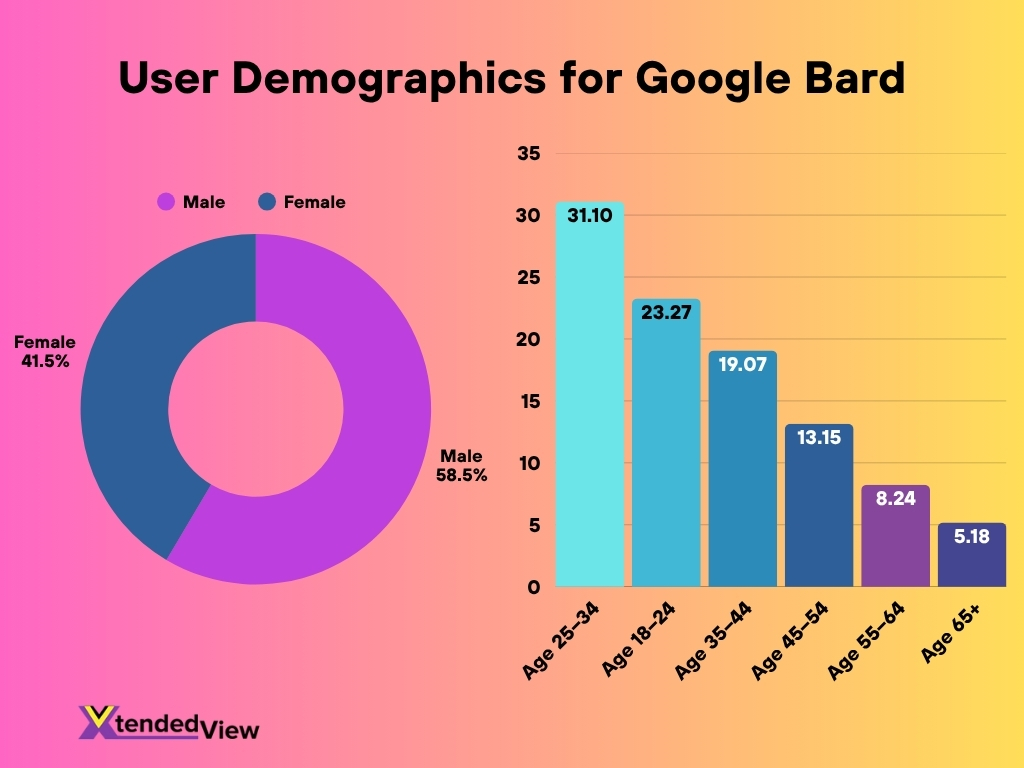
Google Bard User Demographics
- Worldwide gender distribution, 58.52% male users and 41.48% female users.
- Age group 25‑34 accounts for 31.10% of users.
- Age 18‑24 covers 23.27%, 35‑44 19.07%, 45‑54 13.15%, 55‑64 8.24%, 65+ 5.18%.
- U.S. adults in 2025 spent 4 h 39 m/day on mobile vs 2 h 20 m/day on desktop.
- Projected to exceed 1 billion users in future years.
- Active recurring users are estimated at 47 million in 2025.
- The U.S. led the traffic share at 15.94%.
Google Bard Age Group Statistics
- Age 25‑34, 29.7% of all visits (Feb 2025).
- Age 18‑24, 23%–24%.
- 35‑44, 19%, 45‑54 13.15%, 55‑64 8.24%, 65+ 5.18%.
- Dominance of younger demographics reflects appeal to the digital‑native workforce.
- Younger users show more mobile‑heavy engagement.
- A larger share of content‑creation tasks among younger users.
- Increased participation from students and early‑career professionals.
- The 25‑34 segment expanded as traffic crossed 350 million MAU.
Google Bard Mobile vs Desktop Usage
- February 2025 visits, 193.3 million via desktop vs 90.83 million via mobile.
- Desktop 68% of traffic, mobile 32%.
- Mobile bounce‑rate 44.78%, desktop 27.1%.
- Global device usage context, mobile 56.52% vs desktop 41.89% (2025).
- U.S. adults average 4h 39m/day on mobile vs 2h 20m on desktop.
- 62.79% of Gemini traffic came from desktops in one analysis.
- Desktop users tend to have lower bounce and higher task depth.
- Gemini adoption is tied strongly to work environments and productivity use.
Google Bard Usage Statistics
- March 2025 MAU 350 million, DAU 35 million.
- May 2025 visits grew beyond 400 million monthly.
- January 2025 visits 267.6 million, up 2.4% MoM.
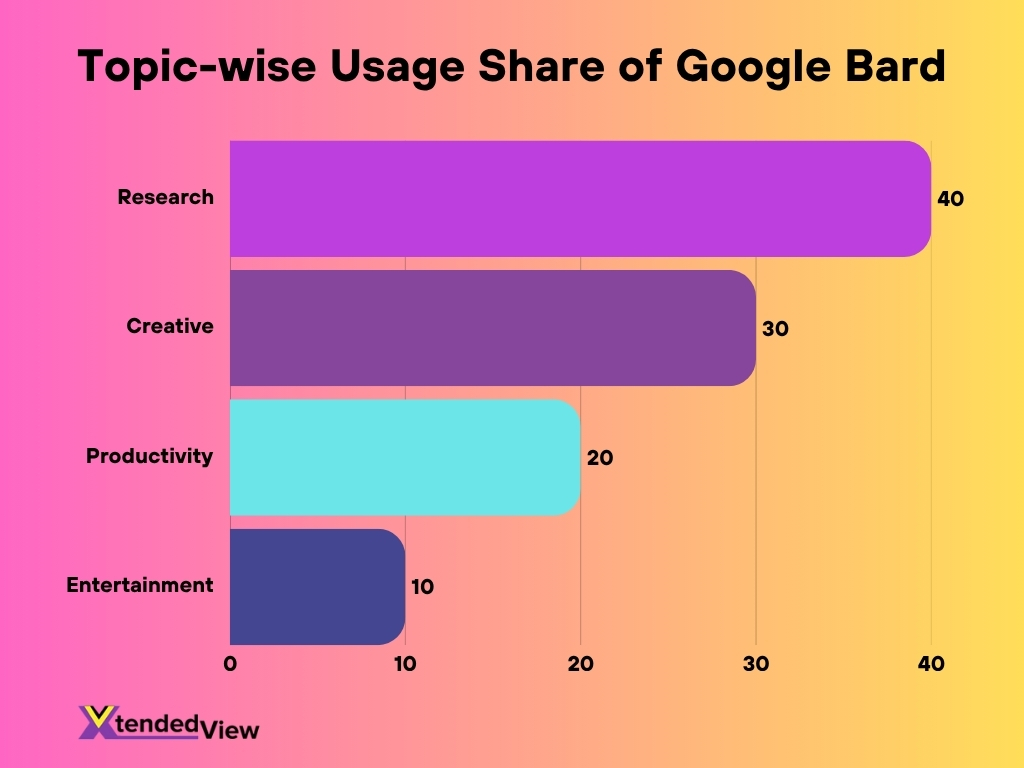
- 40% of usage for research, 30% creative tasks, 20% productivity, 10% entertainment.
- 2023 monthly visits averaged 142.4 million.
- February 2025 unique visitors: 67.29 million.
- Global chatbot usage share 4%.
- Gemini momentum accelerated in early 2025 adoption.
Most Popular Topics on Google Bard
- 40% use Gemini for research.
- 30% for creative writing and content.
- 20% for work and education productivity.
- 10% for entertainment purposes.
- Developer and coding requests are rising due to model improvements.
- Topic volume is rising in business workflow automation.
- Queries represent longer exploratory sessions.
- Technical help and data analysis tasks are growing.
Google Bard Cost and Expenses
- Estimated query cost $0.006–$0.031.
- The dataset used 1.56 trillion words during earlier stages.
- Google AI spending in billions overall during 2024/25 cycles.
- Subscriptions and enterprise plans were introduced to recoup compute costs.
- Larger models (Ultra/Pro) incur greater compute expense.
- Flash versions are designed to reduce the cost per token.
- Enterprise scaling is expected to drive cost efficiency.
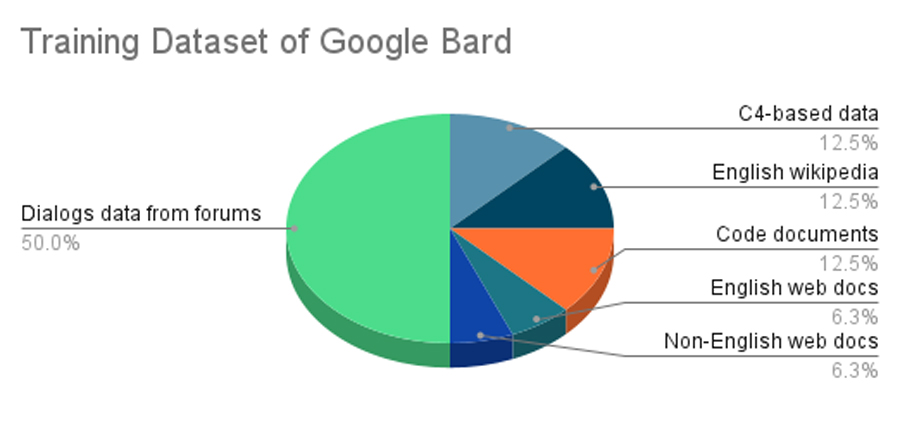
Google Bard Training Dataset Statistics
- Dialog data from forums make up the largest portion (50%) of the dataset, indicating Bard’s strong focus on conversational understanding and real-world dialogue patterns.
- C4-based data (12.5%) contributes to Bard’s broad general knowledge foundation, derived from the Colossal Clean Crawled Corpus.
- English Wikipedia (12.5%) adds factual and encyclopedic knowledge, helping Bard handle information-rich queries accurately.
- Code documents (12.5%) provide programming knowledge, allowing Bard to interpret and generate code effectively.
- English web documents (6.3%) offer diverse online content, improving Bard’s contextual understanding and stylistic flexibility.
- Non-English web documents (6.3%) ensure multilingual competence, broadening Bard’s ability to interact across different languages.
Integration of Bard with Google Products
- AI Overviews reached 2 billion monthly users.
- Gemini is integrated into Docs, Sheets, and Photos.
- Gemini Live is available on Android and iOS for visual input.
- 9 million developers building with Gemini APIs.
- 2.3 billion Workspace interactions in early 2025.
- Voice assistant and search assistant integration is active.
- Android default integration boosts global penetration.
- Emphasis shifting from chat to productivity automation.
Google Bard Languages and Availability
- Supports 40+ languages.
- 9 Indian languages supported in Gemini Live.
- Available in 200+ countries/territories.
- U.S. 17.5% traffic, India 9%, Indonesia 5.3%.
- Expanding support across Europe and Asia.
- Delivered via the Google app in many markets.
- Multilingual support is key to education and enterprise expansion.
Historical Timeline and Milestones
- Bard launched in 2023, rebranded Gemini in February 2024.
- Reached 30 million visitors in March 2024.
- 142.6 million monthly visits by late 2024.
- Gemini 2.5 models announced at Google I/O 2025.
- 400 million MAU by May 2025, 450 million by July.
- Ecosystem shift from chatbot to platform assistant.
- Regulatory oversight influenced rollout.
- Deep multimodal capability introduced.
Google Bard vs ChatGPT Statistics
- ChatGPT had 800 million weekly active users in 2025.
- Gemini 450 million MAU by mid‑2025.
- February 2025 visits 284.1 million.
- Gemini 13.4% U.S. chatbot market vs ChatGPT 59.5%.
- Gemini 3.19‑min sessions vs ChatGPT 8.44‑min.
- Gemini costs per query $0.003–$0.028.
- Gemini powered 21% of generative search usage globally in 2025.
- Competes via deep OS and Workspace integration vs app‑centric rival.
Future Growth and Projections for Bard
- MAU forecast to surpass 500 million by end‑2025.
- U.S. AI adoption could exceed 38% in 2025.
- Embedded assistant usage is expected to grow faster than chat usage.
- Expansion in Asia, Latin America, and Africa is ongoing.
- Higher‑context, multimodal models driving professional adoption.
- Efficiency upgrades to reduce compute cost and expand user access.
- Regulatory themes present national rollout considerations.
- DAU comparisons, Gemini 35 million vs ChatGPT 160 million in early 2025.
Frequently Asked Questions (FAQs)
450 million monthly active users.
13.5% market share in the U.S. for generative AI chatbots.
17.54% of traffic originated from the U.S. in February 2025.
29.7% of users were in the 25‑34 age group.
US$0.006 to $0.031 per query.
Conclusion
The journey of Google Bard, now evolving into Gemini, is marked by rapid scaling, deep ecosystem integration, and continuous model upgrades. With 450 million monthly active users as of mid‑2025 and expanding into more languages, devices, and enterprise workflows, the platform has become a significant player in generative AI. Yet when compared to ChatGPT, differences in usage patterns, session duration, and market share underscore the varied competing strategies at work.
For U.S. businesses, the fact that Google’s AI is accessible via Search, Android, and Workspace means that Bard/Gemini’s future may lie less in standalone chat and more in embedded productivity.